

See the business.
Not the tables.
Connect the accounting, ERP and files you already use. Titanium asks the questions a founder would (cash, customers, mix, concentration) and answers in plain language.
Real screenshot
One question, one chart.
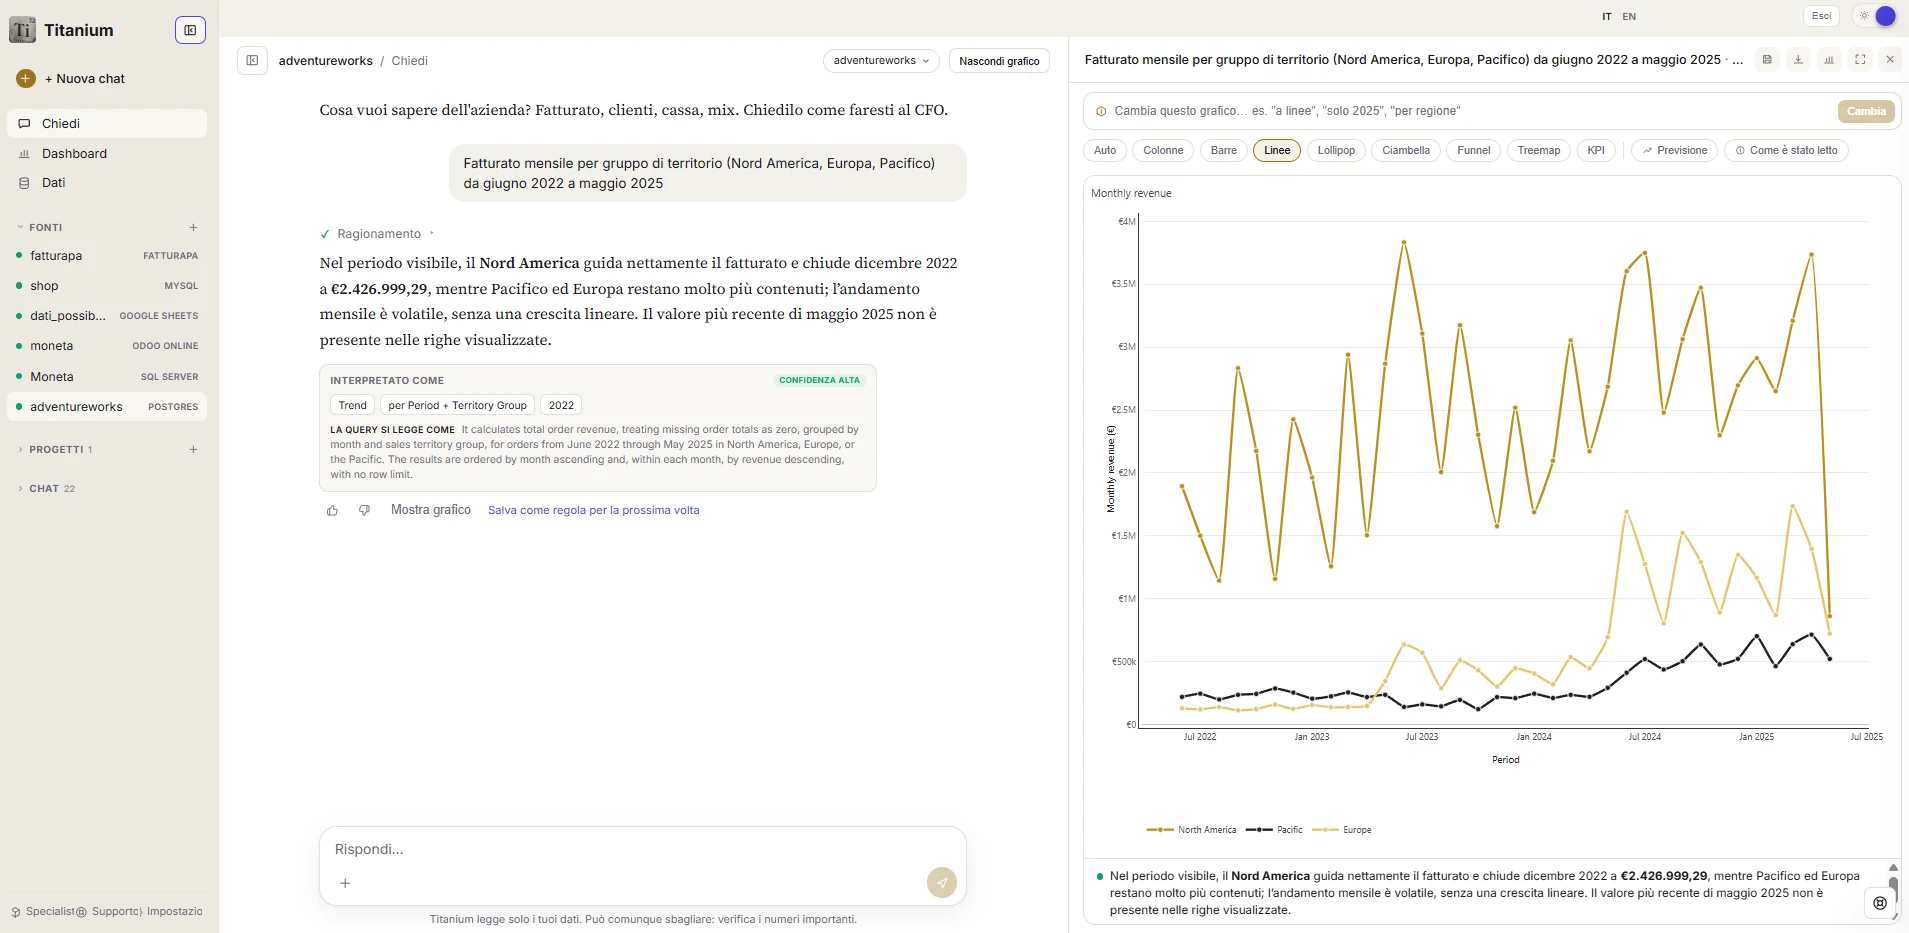
Monthly revenue by area, three years of data: the answer in words on the left, the chart on the right, which you can change by typing “make it a bar chart”.
An analyst on your data
All your sources, one analyst.
Titanium connects the systems you already use, studies them like an analyst on day one and answers by joining the data together. Even tailored BI, which used to be a months-long project, it builds on its own.
Connects
ERP, databases, SDI e-invoices, banks, sheets.
Joins
The sources together, by customer, month or VAT number.
Analyses
Answers in words, figures and a chart, and explains why.
Builds
Tailored dashboards and forecasts, on its own.

- Before
- → With Titanium:
- Connect
- Ask
- Save
- Dashboard
 Banks
 SDI e-invoices
 PostgreSQL
 SQL Server
 MySQL
 Oracle
 Odoo
 FatturaPA
 Excel
 Google Sheets
 CSV / TSV
 ODS
 Google Drive
 OneDrive
 FTP
 PDF
 Word
 PowerPoint
 Plain text
 Images
 HTTP API
From the books to a briefing
One path. You connect the systems you already use, Titanium reads what the numbers mean, you ask like a founder and keep the views you start the week with.
- 01
Connect
Point to Postgres or SQL Server, connect your bank, or upload Excel files, invoices and folders. Access stays read-only.
Go to ConnectRead-only hubRead-only - 02
Read
Titanium learns what the numbers mean (revenue, customers, invoices) so you do not have to name every table.
- 03
Ask
Ask as you would ask the CFO. One takeaway and a chart to pin.
 Q1 by region
NAEMEAAPAC - 04
Keep
Pin the views that matter to a dashboard. Refresh on a schedule. Start the week already informed.
Open the dashboards

Ask preview · last quarter
A briefing before you connect
One question. A read-only query, Python in a sandbox, the picture and a takeaway: growth, mix, concentration.
Generated query · read-only
SELECT region,
       date_trunc('month', signed_at) AS month,
       SUM(mrr) AS revenue
FROM   subscriptions
WHERE  signed_at >= '2026-01-01'
  AND  signed_at <  '2026-04-01'
GROUP BY region, month
ORDER BY region, month;
- +75% Jan–Mar
- EMEA doubled in March
- NA still 47% of Q1
- Top account 18%
Revenue rose from €800K to €1.4M between January and March. EMEA doubled from February to March and drove the acceleration; North America remains the largest region, at 47% of the quarter. The momentum is broad enough to carry into Q2. The top account is 18% of the mix; keep an eye on it if you are raising capital or extending payment terms.
Your numbers stay yours
Titanium never writes to your systems. Every query is a single read, checked before it runs, with a row cap and a timeout. Python analysis runs in a sandbox: no network, no files, no writes. Credentials stay encrypted. Charts are drawn in a sandbox.
The video
Titanium in 2 minutes.
Connecting the data, asking in Italian, machine downtime in the factory, the board that updates itself.
What the video shows
Moneta's Titanium in 2 minutes: from tailored BI that takes 6+ months and €30,000 to a dashboard ready the same day. Connecting databases, ERP, MES and Excel read-only, asking in Italian, the team of AI agents, machine downtime in the factory and the board that updates itself.
- 1.Before and after. Traditional tailored BI takes 6+ months and over €30,000. With Titanium you start the same day.
- 2.Connecting the data. Databases, Odoo, SDI e-invoices, Excel, machine data from the MES and the bank. Read-only, encrypted credentials, data stays where it is.
- 3.Asking in Italian. Six AI agents plan, write and review the query and answer with a conclusion, figures and a chart.
- 4.Titanium in the factory. Machine downtime cost by machine and cause, with impossible data excluded (sample data).
- 5.Real case. Automotive components maker, 45 presses, 350,000+ machine hours: Titanium's monthly efficiency matches the manual calculation to the cent.
- 6.The board. Saved answers become a board that updates itself and is edited by writing.
Launch · 27 November 2026
Only 10 places · 3 months free
Titanium launches on 27 November.
The first 10 places get 3 months free. Ask to join: we read every request and reply within a few days. Those who join receive:
27 days and 18 hours until the launch of Titanium, on 27 November 2026.
- Three months of Titanium at no cost, from 27 November 2026.
- The launch price locked for the whole first year.
- Set-up done by us: we connect the first data source together with you.
- A direct line to the people who build Titanium: your requests go into the product.
Places limited to 10 companies. No commitment: the request is not a purchase.
Frequently asked questions
In short.
Do I have to build a data model or know how to write SQL?
No. Titanium studies the connected tables on its own: what each row represents, the codes, the real links. You ask the question as you would ask a colleague, one of your staff or your analyst.
Can Titanium modify or delete my data?
No. Only reading is allowed, checked before execution and run in a read-only transaction with time and row limits.
How can I trust a number?
The query and the tables used are always viewable. If a fallback method was used it is stated, and every answer carries its own reliability level.
How much does Titanium cost?
Prices are coming soon: we will publish them shortly. They will depend on how many sources you connect and how many people use it.
Titanium
Ask your data its first question.
Tell us where your data is: we connect the first source together, read-only.